Here we are, another interesting month later. In news this month, the Fed increased the Fed funds rate by 0.75% surprising everyone, since their guidance had suggested 0.50%. Alongside this, crypto had an absolute bloodbath of a month with several exchanges locking withdrawals and some tokens basically destroyed.
San Diego’s inventory has now reached the same level as 2020, replacing 2 years worth of depleted inventory in half a year.
So what effect has all this had on the housing market in San Diego?
Inventory
Very good news on inventory this week, as San Diego’s inventory has now reached the same level as 2020. This is data for the San Diego, Carlsbad, San Marcos area from research firm Altos Research – the dashed line is the newest weekly data. The solid line is the 3 month average.
This is pretty amazing because we’ve basically replaced 2 years worth of inventory depletion in half a year. Is this due to new homes? No, this is simply what happens when demand evaporates.
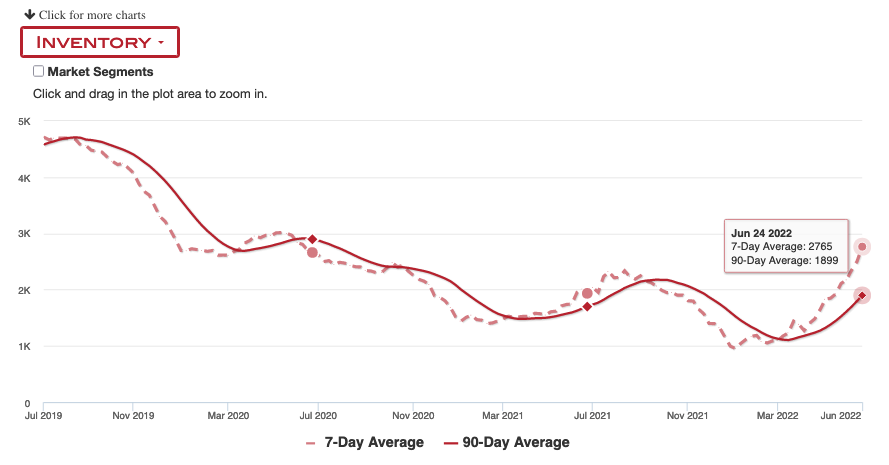
Here are some values to illustrate. In January we fell to a low of 952 and now we’ve built up to 2765 houses.
- June 26, 2020: 2661 ⬇️
- June 25, 2021: 1935 ⬇️
- Jan 7, 2022: 952 ⬇️
- June 24, 2022: 2765 🚀
Obviously, we have to build back up to 2019 to get to more normal levels of inventory, but this is excellent progress. Especially since the RE industry has been telling everyone that no one would be selling homes since they’ve locked in low rates.
Housing Cost
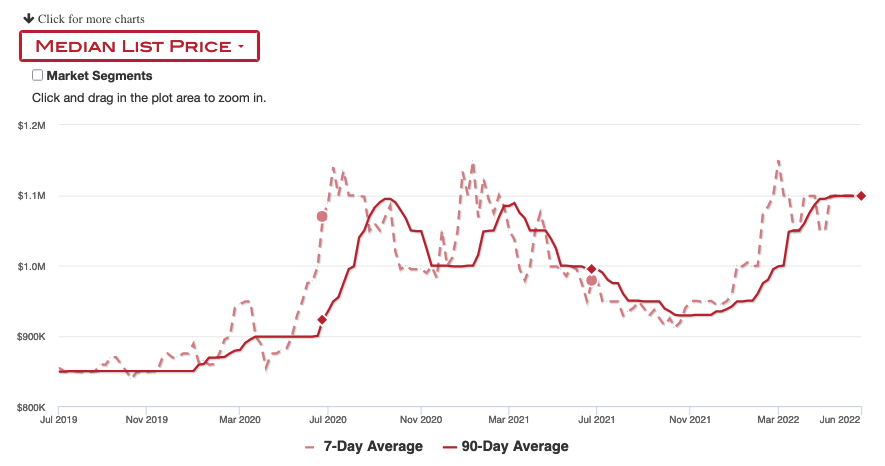
Median list price seems to have plateaued which is good news. I want to see it dropping but sellers have seen the highs and will hold on to their hopes for a couple of months. This is listing price, not sale price.
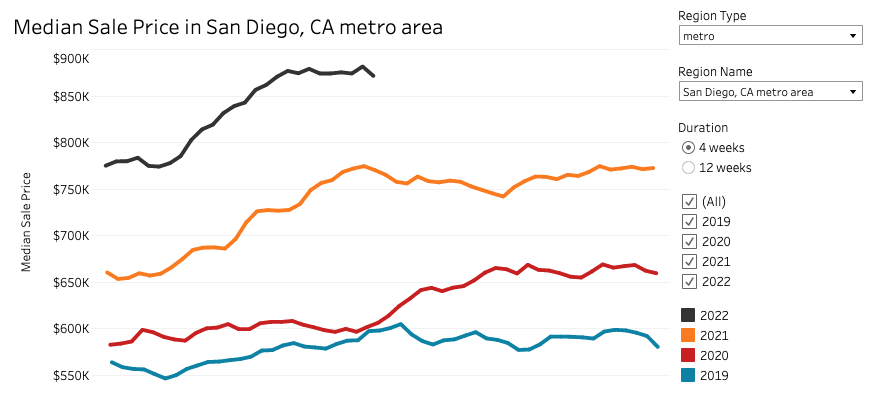
Altos doesn’t provide sale price. but here’s Redfin’s 4 week avg of sale price. It’s lagging, but it does seem to mostly show a similar plateau. I’ll be checking this regularly.
Median Days on Market
Median days on market are finally increasing! This is also good news. It means houses are sitting a tiny bit longer before going under contract.
Median days on market has now increased from the same level in 2021, although still very low.
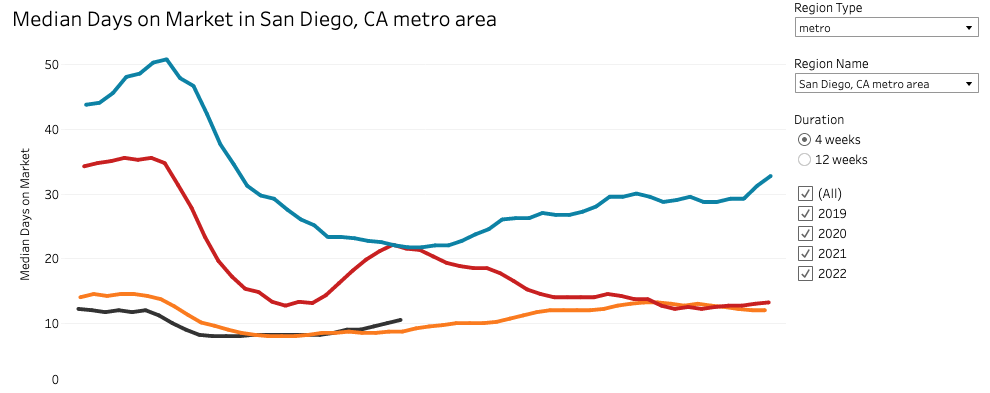
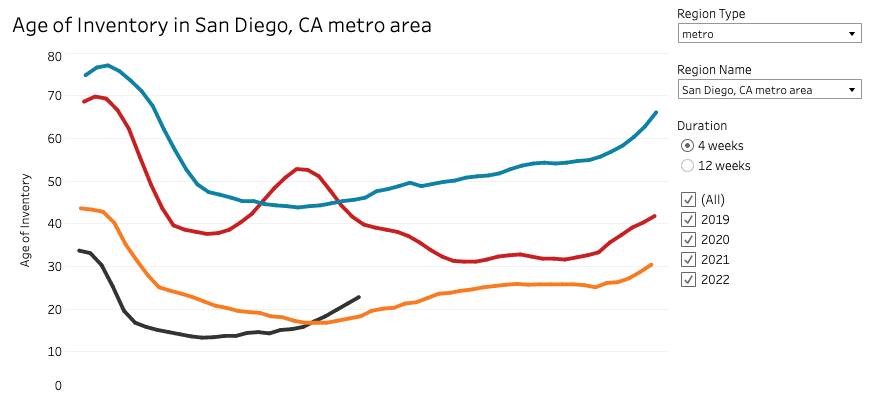
One interesting thing I learned recently though, DOM is only counted once a house is sold. So if there are 30 houses sitting and 5 houses sell in a month, DOM will only count the days until pending for those 5 that sold. I was hoping DOM would be an early indicator but found out it isn’t one. Age of Inventory might be though.
Age of inventory does show us the houses that are sitting and not getting sold. It is improving as well as it doesn’t need a house to sell to show up in this statistic.
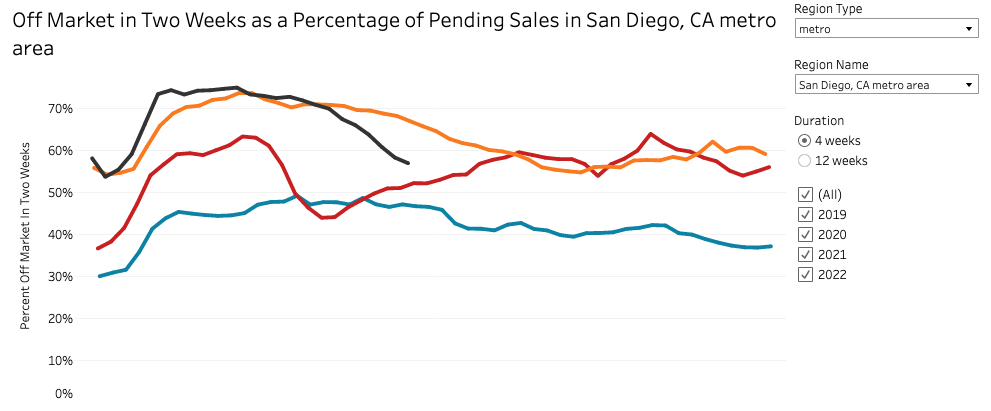
Another measure of slowdown in the percentage off market in two weeks. This is heading steadily down, which means more houses are sitting longer than 2 weeks. I can see this in my Zillow or Redfin searches, which now have some homes sitting.
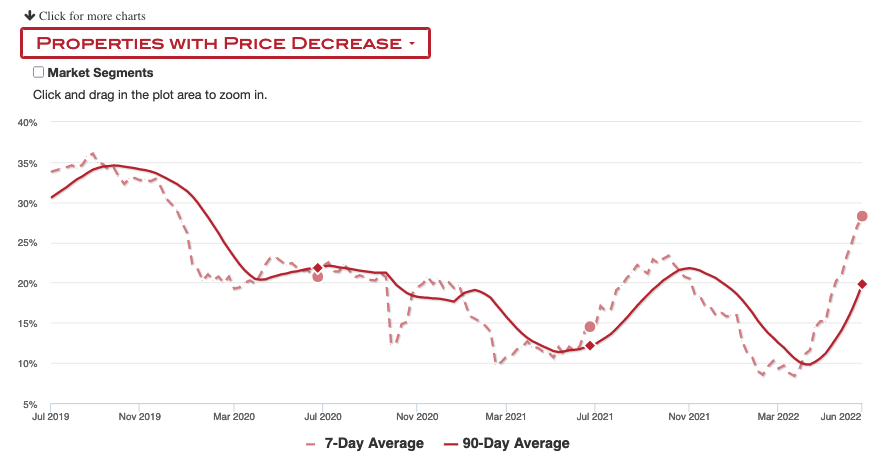
Price Drops
Finally, the number of listings with price drops is steadily climbing. At 28%, it’s now much higher than the same week in 2020.
Pending Sales
So I mentioned earlier that demand has evaporated but it’s hard to see in any of these graphs. That’s something we can see in the pending sales graph. Currently, pending sales are 37% lower than 2021 but also, have dropped well below 2020 and 2019.
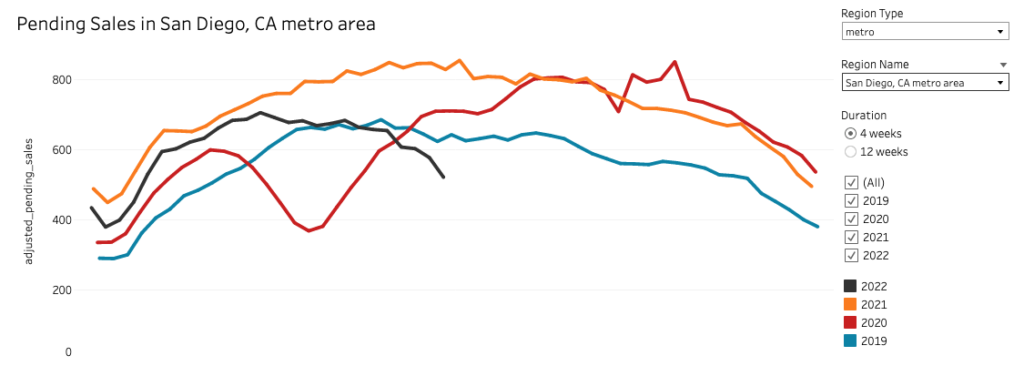
This is a shocking drop in demand, even for me, someone who’s been expecting demand to drop. I’ve no idea whether it’s fueled by affordability for new buyers or investors stepping away but this is impactful.
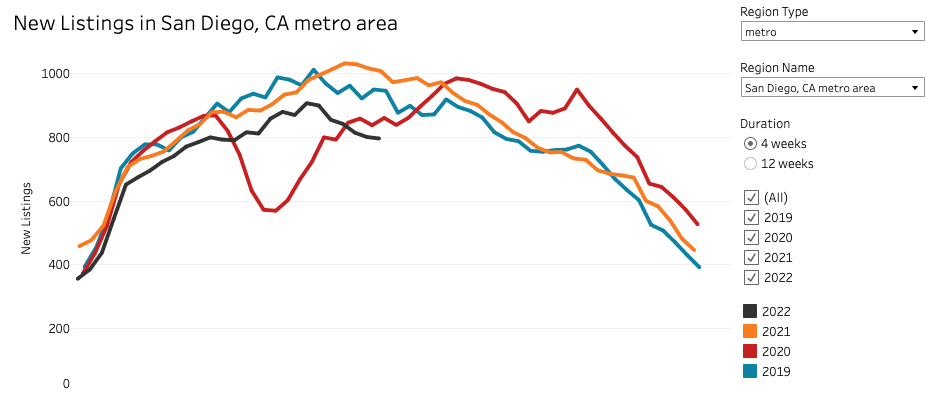
We already know that this isn’t due to a lack of inventory as inventory is climbing as shown above. Even though new listings have sunk a bit, as shown below, it’s the lack of demand causing rising inventory.
Final Words
There ya have it. Very solid movement towards a balanced market as inventory steadily heads up, as well as price drops. The Fed’s interest rates have definitely had an effect on demand.
Something I’ve seen as I look into this data, is that the media interviews RE experts that tend to cheerlead the market, because they are in the industry. So it’s really worthwhile to look this stuff up myself and try to understand the market. To do the same, check out these data sources for your own market.
Disclaimer: I’m an idiot first time home buyer. I’ve never taken an econ class in my life. I’m just sharing what I see and learn as it happens. I am 100% certain I will get things wrong, so don’t take any of this as the golden truth.