Here’s an update for the San Diego market in May. Still really hot, but leading indicators of inventory and price drops are showing a shift.
Inventory
Found a new source for weekly inventory data, and that is the excellent Altos research. This is data for the San Diego, Carlsbad, San Marcos area. I like this graph because it shows actual values as well as a visual way to compare against previous years.
Inventory is improving year-over-year for the first time in 3 years, which is very good news, but we have a lot of catchup to do to get to what might be a more normal inventory.
The dashed line is the weekly data, and the dots show you the years prior. This graph shows that the current weeks inventory is 1926, which is 12.5% more than last year this week, but 61% less than 2019.

Housing Cost
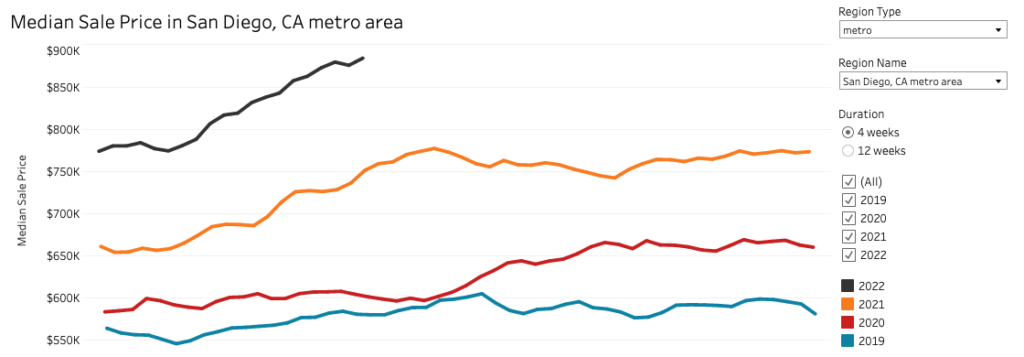
Median sale price still going up but perhaps not as rapidly as before. For the last 4 weeks median sale price according to Redfin was $884k.

Median Days on Market
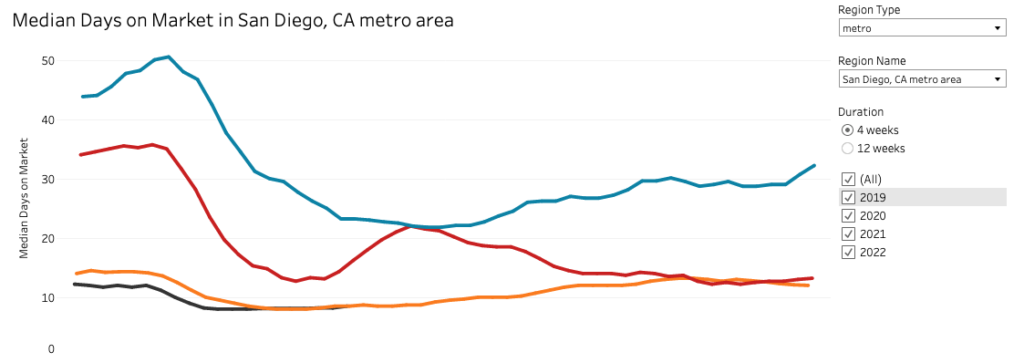
This stat continues to stay low, it’s probably not even possible to go lower. This means things are still very hot in San Diego.

Percentage Pending within 2 weeks
This is another view of “hotness” and San Diego about two months ago was heading the pack on this metric. This has dropped from last week but that also looks seasonal. Still San Diego is higher than both SF and LA on this metric. Still not much change in the market here in San Diego.

Active Listings with Price Drops
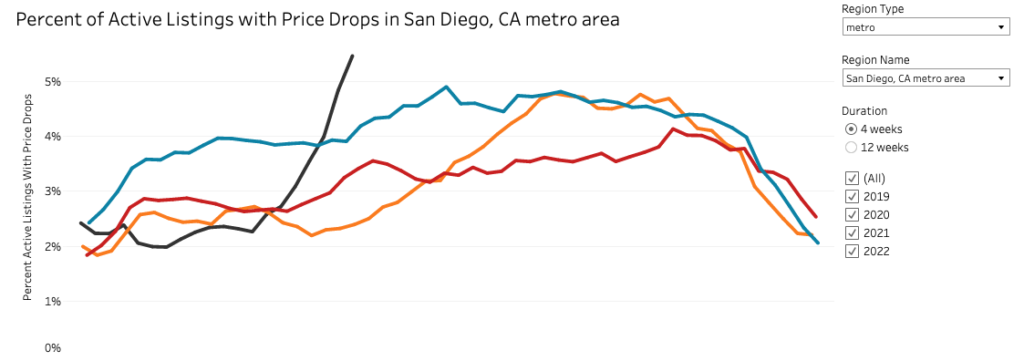
Finally, some changes are happening. Price drops are on the rise although it is early seasonally for this to be happening. Currently the percentage of price drops is higher than all 3 prior years that Redfin reports. Prices are so high that the price drops aren’t really making homes more affordable, but it’s a very leading indicator of sellers maybe coming back down to reality when pricing homes.
It remains to be seen if there’s a change in the sales price data in 2 months.

This is echoed in Altos’ weekly data, where the price drops are at 20.25% this past week, as compared to 11% last year and almost matching 2020 at 22.45%. That last part is kinda surprising because May 2020 was a really bad, uncertain time.
It’s weird that the actual percentages from Redfin and Altos are quite different, I’m guessing they have different methodologies to collect the data. The trend appears to be the same though.
Final words
Market is still crazy hot in San Diego, which is to be expected. When the market softens, it softens first in the less in-demand places to live, and San Diego is very in-demand. However, pre-GFC San Diego’s market eventually fell as well and I’m expecting the same again.
Much of San Diego’s in-migration is from tech jobs both WFH and actual companies setting up shop here. And the tech market is practically in a dot-com style crash right now. I believe that will have a greater effect on California’s housing market than the rest of the country.
Disclaimer: I’m an idiot first time home buyer. I’ve never taken an econ class in my life. I’m just sharing what I see and learn as it happens. I am 100% certain I will get things wrong, so don’t take any of this as the golden truth.

I’m from San Diego and i wanted to say that I love you blog. Keep up the good work.
Thanks! I was searching for something like this, as I watch and wait in this market, and couldn’t find anything. So I just started posting.