Happy Holidays! We’re almost at the end of the year and the market is in a coma these days. Let’s look at the latest data.
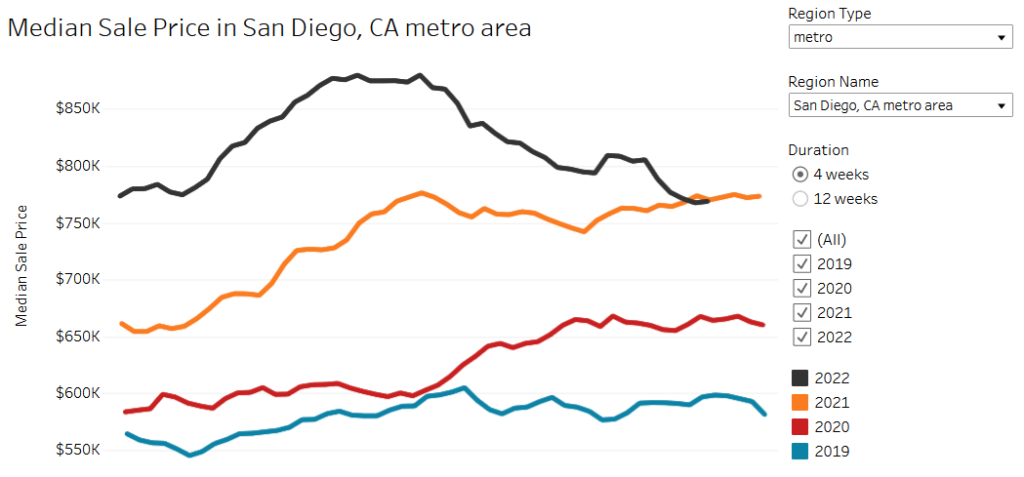
San Diego median sales price wipes out all yearly gains.
All Altos Research data is from the San Diego-Carlsbad-San Marcos metro area.
Redfin data is from the San Diego metro on Redfin data center.
Some updates possible if I see updates from these sources.
Inventory
Inventory has sort of … stalled for the year? This is a bit unusual, it should be going down. Instead it’s plateaued, so if you take seasonality into consideration, this is a good sign. Despite the sellers delisting, buyers have backed off so much that inventory is not dropping as much as it should.

You can see in previous years, that the dashed line is going quite steadily down at this time of the year. It started its fall in August but seems to have stalled out in this weekly data. This might change in the next month – what with the drop in mortage rates recently from 7%+ to 6%+ but so far things are holding up.
Home Prices
Prices are continuing to slide down, which is great news. People expect a hard crash but that’s just silly, housing moves slowly and this is a blistering pace for a housing correction anyway.
- According to SDAR, median price is down 3.2% from 4 weeks ago (38% annualized).
- According to Redfin, median price is down 2.5% from 4 weeks ago (30% annualized).
One exciting thing to notice – San Diego has now wiped out year over year gains! That’s right, a house today costs the same as a house exactly one year ago. The stunning gains of this spring have evaporated.
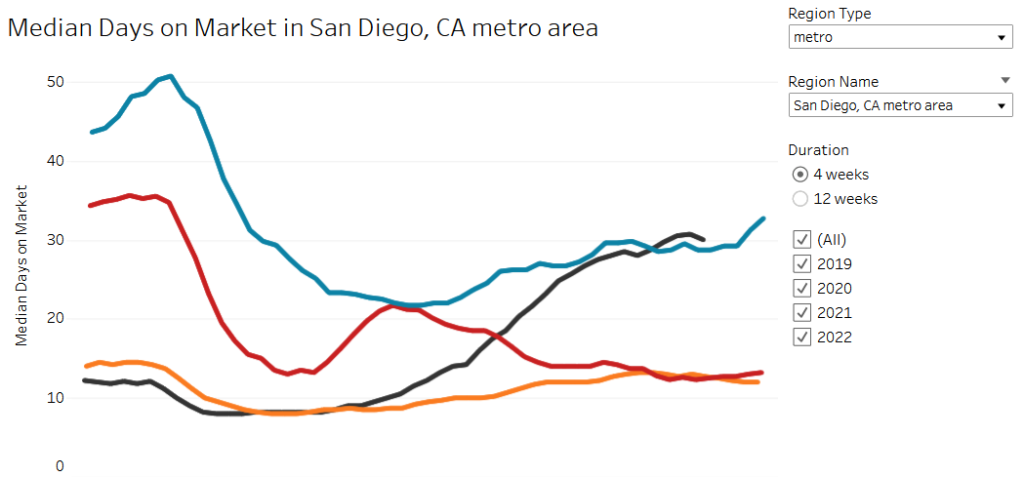
Median Days on Market
DOM is an indicator of market health, and normal for San Diego is 25-35 days. During the last two years, it actually dropped to 8 days! But we’ve now surpassed 2019 levels for this time of year and are at a healthy 30 days!
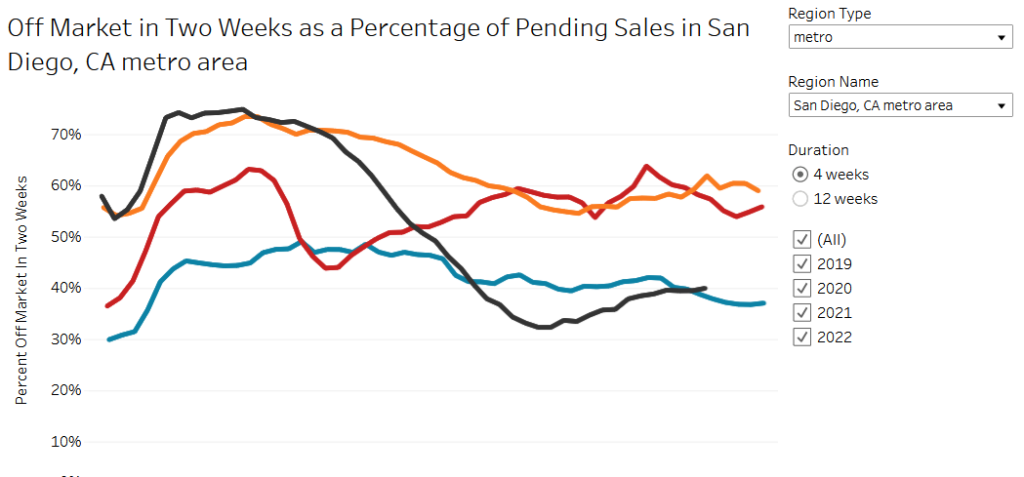
Percent off-market in two weeks is another way to assess market hotness. It’s climbed back up a bit lately but thankfully just to 2019 levels. Note, this is just as a percentage of pending sales, and we know pending sales have plummeted. So that says, few houses are selling but of those that are, about 40% sell within two weeks.
Pending Sales
Pending sales is a great proxy for demand. And it’s a good early indicator, since it shows up earlier than actual sales. Actual sales only close 1-2 months later. We need this to stay low for the correction to continue.
For a few weeks, there was an uptick because mortgage rates dropped. But we’re well on our way down now with sales 53% down yoy.
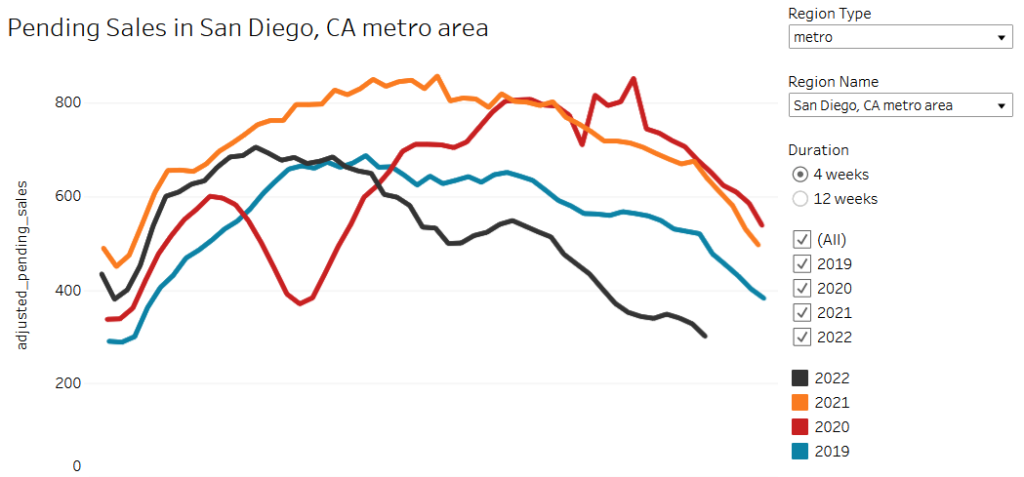
If there’s one thing that reassures me that prices will go down, it’s this stat. Demand is down just a shocking amount. This isn’t just below 2021 pending sales, it’s 42% down from 2019 sales even. I’d be surprised if we’ve dropped this low before in the past decade. I’ll try to dig that stat up if I can.
Final Words
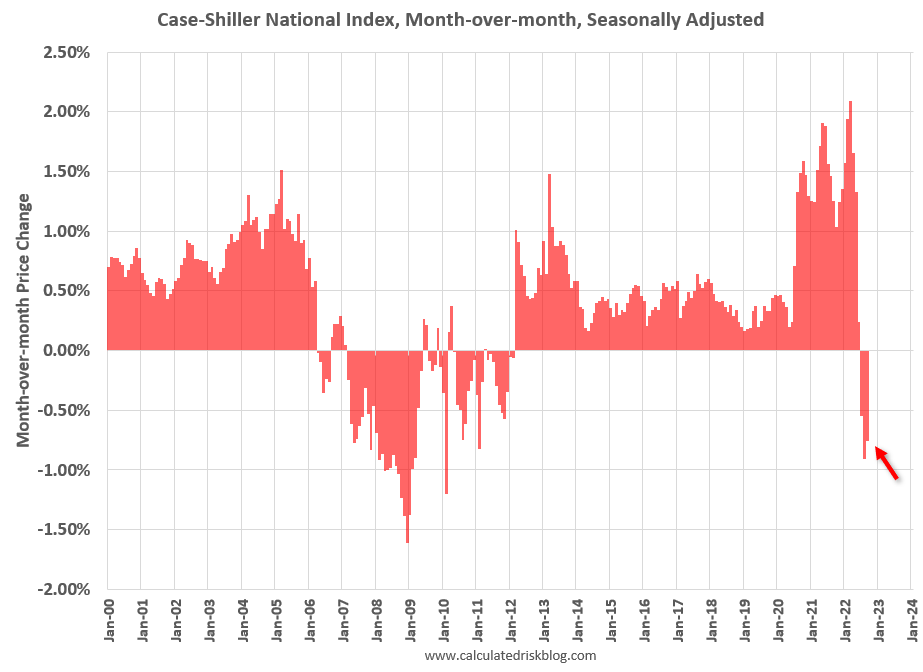
So this past month, prices have continued their decline and news of the bubble has now become mainstream. Case Shiller posted another decline in their index, they second month after years of declines. There’s no denying that prices are correcting.
And perhaps more surprisingly, the Federal Reserve Chair Jerome Powell just said the two words no one expected him to – “Housing Bubble” – at a speech at the Brookings Institute this week.
So you really had a housing bubble, you had housing prices going up [at] very unsustainable levels and overheating and that kind of thing,” said Powell,
– Fortune.com
“So, now the housing market will go through the other side of that and hopefully come out in a better place between supply and demand.”
So with all that, no one except the most diehard bulls can continue to assert that there is no bubble in housing. And this makes it much easier to keep waiting for a better market.
Disclaimer: I’m an idiot first time home buyer. I’ve never taken an econ class in my life. I’m just sharing what I see and learn as it happens. I am 100% certain I will get things wrong, so don’t take any of this as the golden truth.
