One of the most useful data sources I’ve found is the Realtor.com weekly data download. This isn’t an easily accessible interactive graph, but just a CSV that anyone can download. As a result, it’s not data that you will see anywhere for a few weeks.
US Metro weekly data
The US Metro weekly data is a set of data released weekly on Thursdays by Realtor.com. It provides weekly year-over-year percent changes for a variety of statistics per US metro. Sadly, it does not give the actual values which would be even better.
The stats it provides are the following. Note, yoy means year over year. That is, compared to the same week in the previous year.
- Median Listing Price yoy
- Active Listing Count yoy
- Median Days On Market By Day yoy
- Median Days On Market yoy
- New Listing Count yoy
- New Listing Share yoy
- Price Reduced Count yoy
- Price Reduced Share yoy
Early Data
Why do I like this data? You can get really early indication of trends. Here’s an example, this past week’s data (June 18th) with a little spreadsheet magic shows that
- San Diego active listings are now 32% higher yoy
- Riverside, San Bernardino area listings are at 78% higher yoy
- Seattle, Tacoma is 87% higher yoy, and only 28% less than 2019
- Austin at 153% higher yoy, i.e. more than double, and only 25% less than 2019
- Boise at 136% higher yoy, i.e. more than double, and also 12% more than 2019
This is a wonderful improvement from the start of this year, when for e.g. San Diego’s active listings were -50% yoy.
What’s important to note is that this is very early data, you won’t actually see this data in the news until August. Because if you average over the month, and then wait for month end reports, the effect of this data will only show up in August monthly reports.
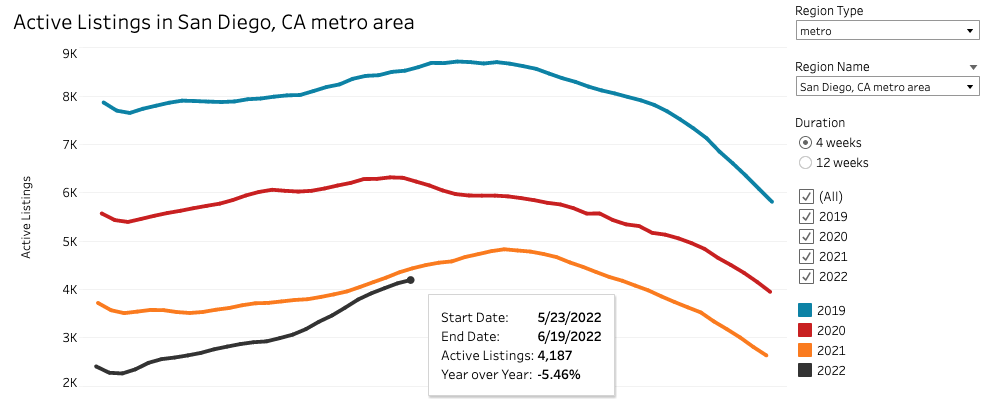
Here for example is Redfin’s current data (averaged over 4 weeks), still showing the year over year data at -5.46%. Of course, they may have different data as well, but the general trend should hold.
Of course, the trend could also change, shift direction by then. It’s important to know that. But it is unlikely given that rates are unlikely to drop by then.
Interpreting the data
As mentioned before, it’s important to look up the data yourself so you can make an educated decision in this market. It’s also important to understand the data, by the way. The actual number of listing is still way below where we’d like it to be, or where it was in early 2019. However, it shows that the inventory is going in the right direction, up. And perhaps, by the end of this year, we’ll have caught up to 2019 in San Diego.
Inventory has not gone up since 2019 and the narrative was that it was due to a massive housing shortage. But remember, inventory is not supply, so we didn’t need to build to see this change direction. But, taking into consideration the upcoming new supply, that should be a welcome addition to this inventory.
For more sources of data, check out the article, Show me the Data.
Disclaimer: I’m an idiot first time home buyer. I’ve never taken an econ class in my life. I’m just sharing what I see and learn as it happens. I am 100% certain I will get things wrong, so don’t take any of this as the golden truth.