Redfin Data Center
As mentioned before, it’s important to look up the data yourself so you can make an educated decision in this market. Here’s one great source – the Redfin data center which has several interactive graphs that can be mined for data.
Redfin Weekly Housing Market Data
Redfin Weekly Housing Market Data is a 4 week moving average, updated weekly, broken down by metro or county. This is what it looks like:
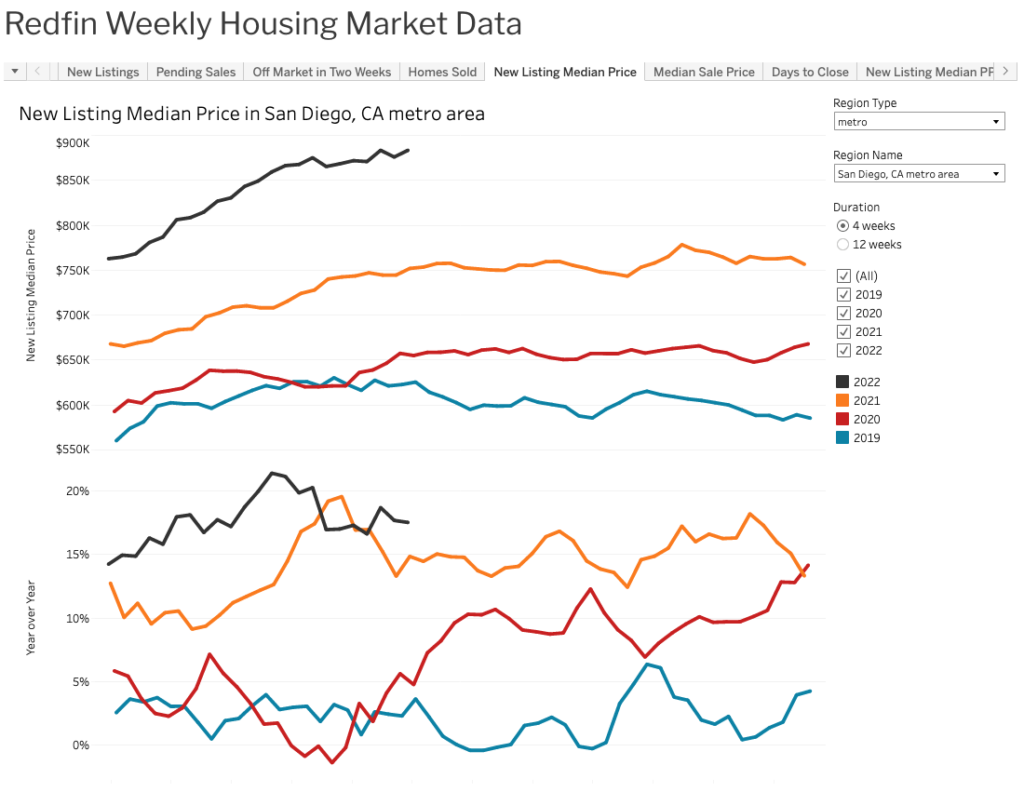
These are interactive graphs that are updated weekly but give you a 4 week moving average. That means they update regularly but they don’t show you the actual weekly numbers. I’ll be writing a post on realtor.com and Altos research which give you weekly numbers as well.
However, given the interactive graphs, you can pick your county or metro, and they give you the following data:
- New Listings
- Pending Sales
- Off Market in Two Weeks
- Homes Sold
- New Listing Median Price
- Days to Close
- New Listing Median PPSF
- Active Listings
- Median Days of Market
- Price Drops
- Age of Inventory
- Months of Supply
- Median Pending Sqft
- Average Sale to List Ratio
- Pending Sales (listing updates)
- Median Sale PPSF
Redfin Monthly Housing Market Data
The Redfin Monthly Housing Market Data shows monthly data, going back to 2012, broken down by metro. Again, there are a number of tabs available, similar to those on the weekly data graph. This is what it looks like:
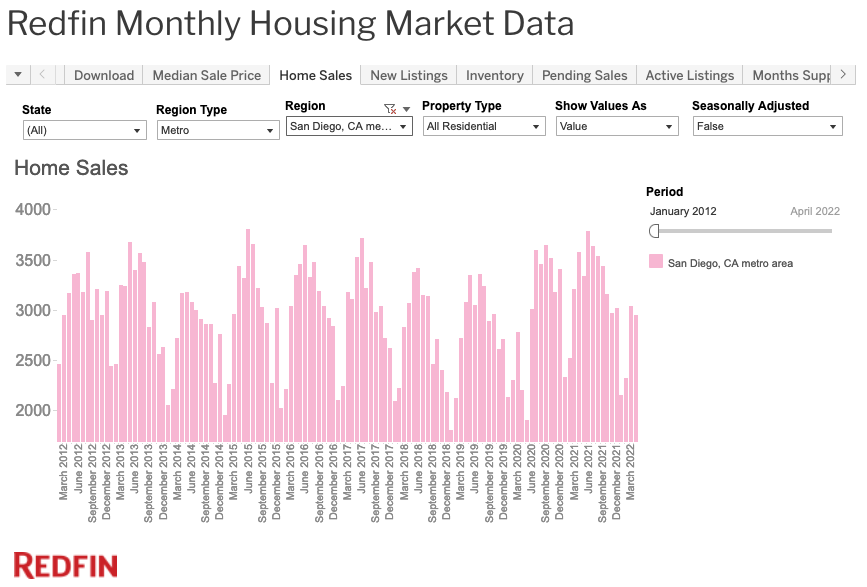
You know how everyone says there’s no supply of houses? You “can’t buy what isn’t for sale”? Well, look at the graph above. It’s clear that in 2021, more homes were sold than in previous years. How is this possible, if there are no homes for sale? It’s because inventory is not supply.
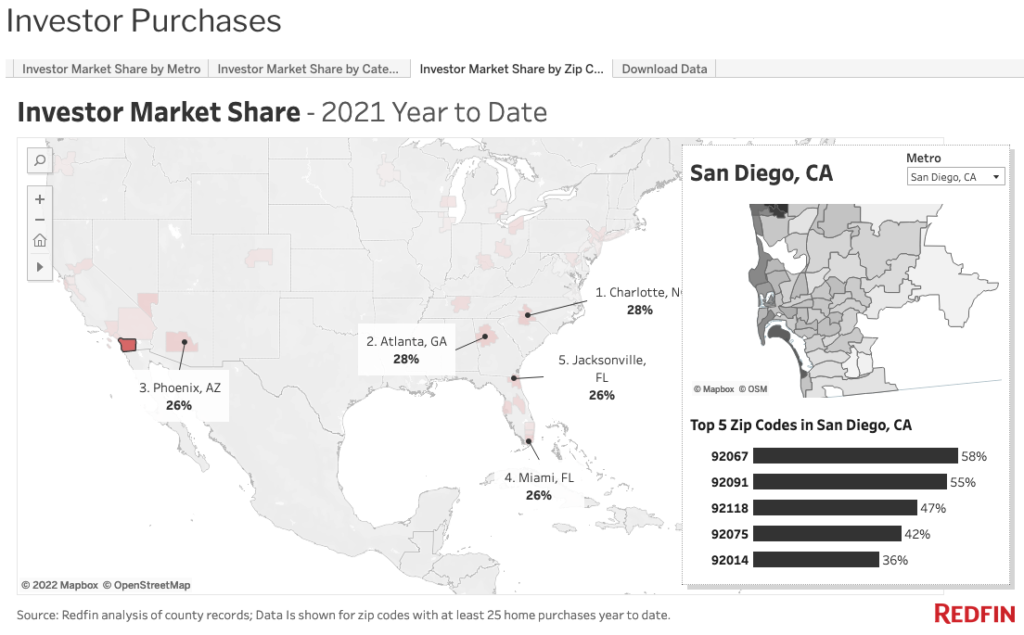
Redfin New Construction and Investor Data
This is a graph most people haven’t seen. In the data center, go to the tab that says New Construction & Investor Data. Under “Investor Market Share by Metro” you can see a map showing the share of home sales in which an investor was the buyer. You can even see the share by zip.
This is valuable to understand where the market might correct fastest as investors back out.
So overall Redfin data center provides a ton of useful information you can use to help you understand the market and answer the questions you might have about historical data. I find it super useful to poke around and watch trends not just in my metro, but metros that are similar to mine.
Hope this helps!
Disclaimer: I’m an idiot first time home buyer. I’ve never taken an econ class in my life. I’m just sharing what I see and learn as it happens. I am 100% certain I will get things wrong, so don’t take any of this as the golden truth.