Well folks, here we are at the end of another month and what do the stats say for the San Diego home buyer today?
San Diego sees its first drop in median sales price, at 4.5% from the peak in 2022.
All Altos Research data is from the San Diego-Carlsbad-San Marcos metro area.
Redfin data is from the San Diego metro on Redfin data center.
Some updates possible if I see updates from these sources.
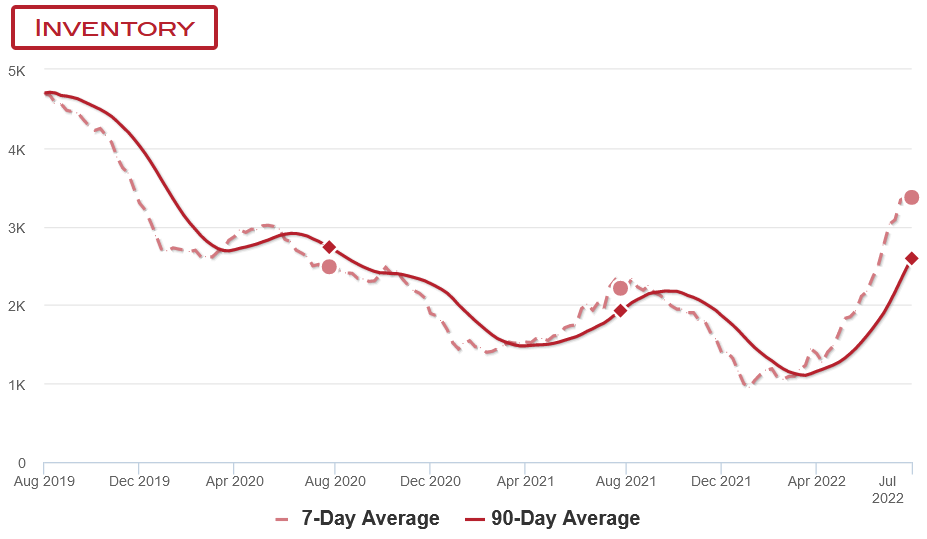
Inventory
More good news on inventory – last month we had 2765 houses and today we’re looking at 3371. That’s a 22% improvement in inventory over June. I’d expect inventory improvements to slow down now that the summer is over but I’ll be watching weekly anyway.
This improvement is also a 52% increase yoy and the last time we saw this much inventory was in late November 2019.
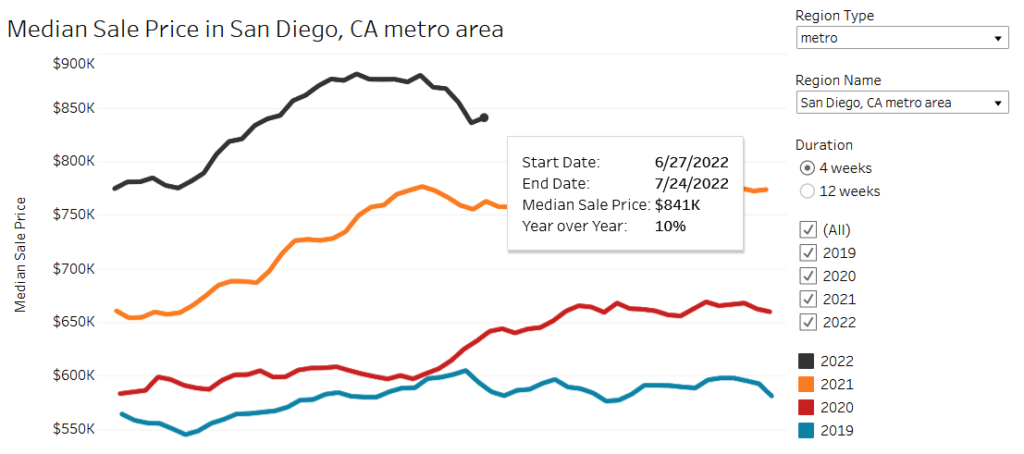
Housing Prices
Median list price is showing a drop finally! Redfin is showing a decline from peak of 881k to 841k, which is a 4.5% drop. While prices often cool after July, in the last 5 years (not counting 2020 as there was no cooling), the price usually drops only 3% by end of year. So 4.5% in July is more than seasonal effects.
Check out an interactive map of price declines across the US.
The month over month drop is 3.2%, while the yoy increase is now at 10%.
Sure, a 3.2% monthly drop looks like nothing when you have 10% yearly appreciation? But careful there comparing months and years – a 3.2% monthly decline would annualize out to a 38% yearly decline. Of course we can’t expect that but that’s why a seemingly small monthly drop can be significant.
This is the first month that we truly register a drop in median sales price so something for buyers to celebrate. While homes are still very overpriced, I’m already noticing homes in my search areas that are posting 100k price drops.
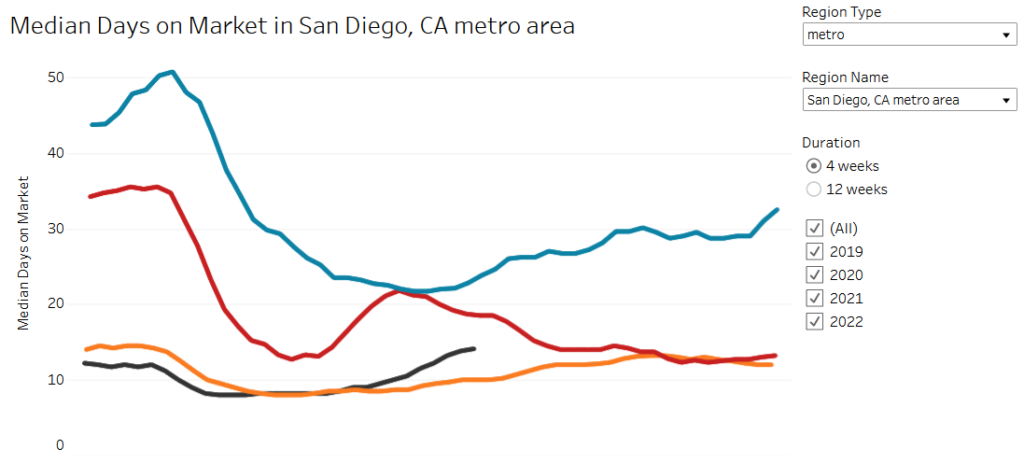
Median Days on Market
This is a good sign of how hot the market is, the lower the number, the hotter the market. Currently, it’s climbing and is now above 2021 at 14 days according to Redfin. Nowhere near normal, but worth it to note that this stat is only reported when a house sells. Houses that are sitting don’t affect this stat until they sell.
Percent off market in 2 weeks is another data point that shows market hotness. The lower this goes, the more houses are sitting longer. And this stat is definitely down – heading to 2019 levels.
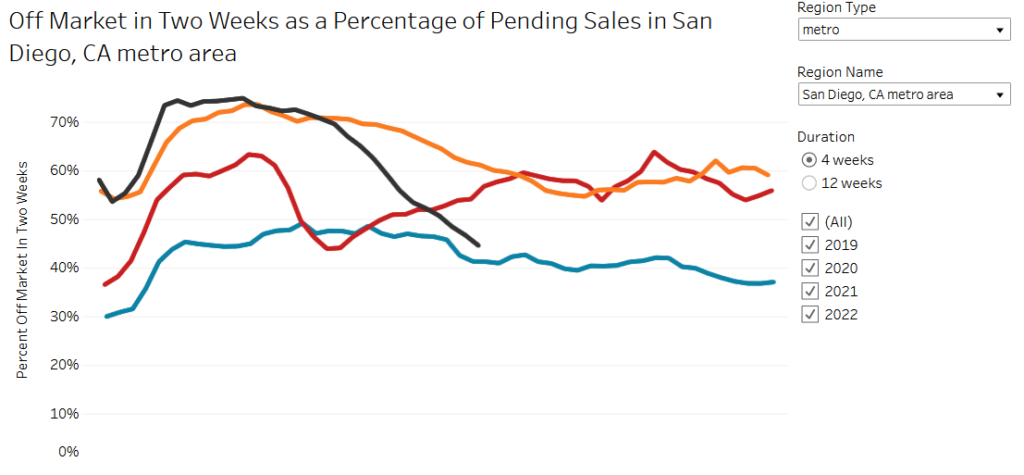
Notice how the line is lower than the 2020 (red) line? Imagine that, houses are moving slower today than they were in the 2020’s pandemic uncertainty.
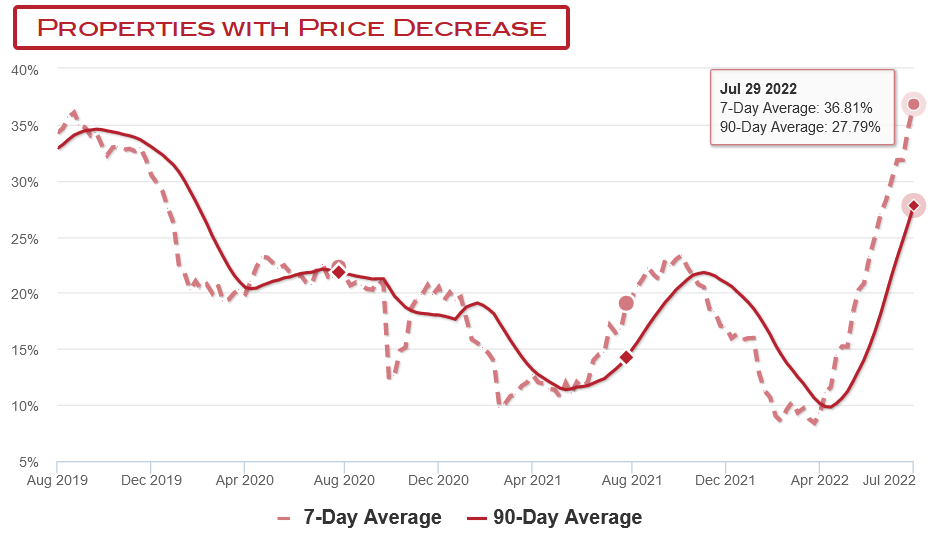
Price Drops
Price drops are at a stunning 36.8% now – higher even than what we clocked at this time in 2019. This bodes well for future prices.
Pending Sales
So why are prices finally falling? The answer is demand. The Fed is raising rates and crushing demand in its bid to fight inflation. And that means buyers of all kinds are priced out. This can be seen in the pending sales data which is 40% less year over year.
When I stopped searching I figured if prices didn’t fall at all, at least I want a market in which I can buy safely with all contingencies. We’re already seeing a safer market for buyers which if you need a home and can afford it today, is a good thing.
Mortgage rates recently have fluctuated quite a bit, even dropping below 5% for a hot second. So we may see this change direction in the next month.
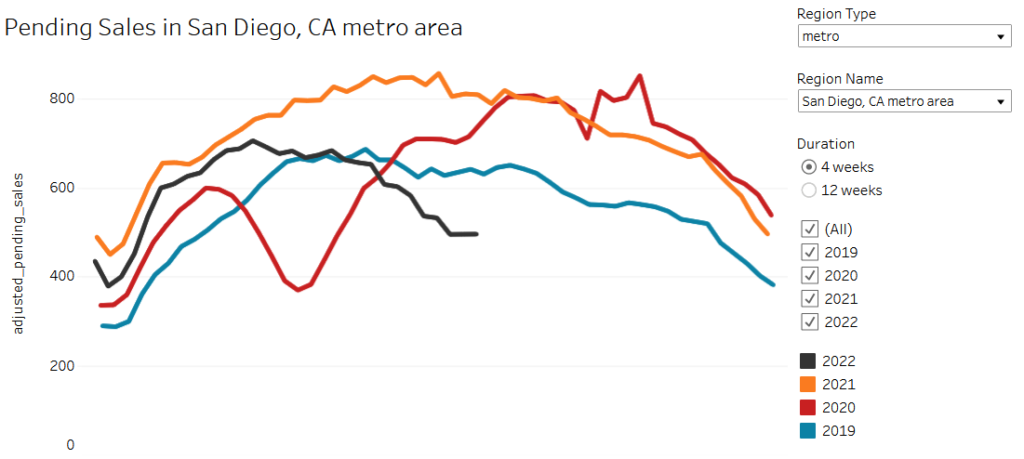
But in the last month, for every 5 sales last year, there were 2 sales this year. This is why inventory is increasing, despite there actually being fewer new listings. This is also why it’s important to understand that inventory is not supply.
Read this to understand the meaning of inventory, and why it’s not the same as supply.
Final Words
So one month more of inventory improvements in the books and a fresh bit of good news as median home prices start to fall at a pace greater than seasonal changes would predict.
Personally, I was unsure if climbing inventory would result in price drops. It was my hope and hypothesis but I’m always watching the data to see what actually pans out. I’m glad to see that prices have started to change direction. And now we hope the Fed sticks to their principles and keeps the rates up until these horribly inflated house prices come back to reality.
Disclaimer: I’m an idiot first time home buyer. I’ve never taken an econ class in my life. I’m just sharing what I see and learn as it happens. I am 100% certain I will get things wrong, so don’t take any of this as the golden truth.