Okay, okay it’s not a crash! It’s a “correction” or is it a “shift”? I don’t know. Call it what you will, the tides have changed. But it’s like watching a crash in slow motion. This could take years!
In the meanwhile, all we can do is watch the data to see the signs. Honestly I didn’t anticipate that things would move as quickly as they have. Already we are seeing price declines in some cities, can you believe it? They are small, but it’s such a turnaround from 3 months ago.
Price Decline Map
The declines seem to largely be in the west, which to be honest makes sense if you think about the exposure to tech. Many western cities boomed due to the influx of cash and tech expats [techxpats?].
To visualize this, I created this map from the excellent data available from the Redfin Data Center.
This map displays the price decline from the peak in 2022.
All metros with a decline greater than 0.5% are included and are colored based on the size of the decline. To see the data used to calculate the percentage, simply hover over any of the metros that are highlighted.
Neat, huh? I’ve been learning tableau to put these together!
You can see San Diego price decline is already 5% and price per square foot is 6% giving the lie to the narrative that it’s just due to smaller homes being sold.
Price Appreciation Map
What’s cool about this is the ability to wonder about something and then create a visual that answers your question.
Another question I had is how much have different metros appreciated from their pre-pandemic price? So I pulled together this map that shows exactly that. I used 3/1/2020 as the “pre-pandemic” price.
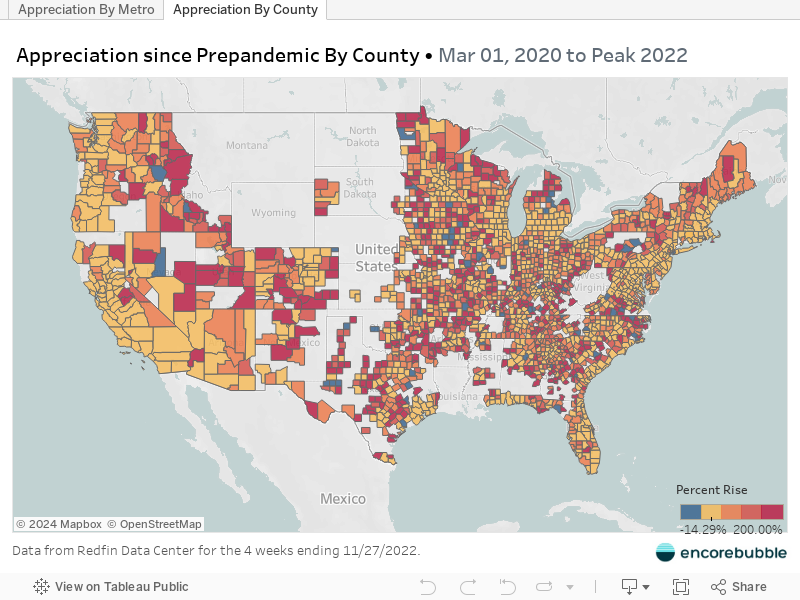
As you can see, San Diego is 48% more than the pre-pandemic price (as of writing this article).
But there are certainly metros with higher price appreciation – some at 200% which is insane!
Hope these visuals were useful, I’ve added a new section to the site called Research, where I’ll be collecting these tools. Check back in to see what’s cooking!
Disclaimer: I’m an idiot first time home buyer. I’ve never taken an econ class in my life. I’m just sharing what I see and learn as it happens. I am 100% certain I will get things wrong, so don’t take any of this as the golden truth.