Context: I found a blogpost from 2006 sharing a layperson’s view on the housing market back then. I was amazed to see how similar our situation is today. This is the second part of comparing our current housing market against that post.
This is part 2/2 of a series, you can find the first part here.
And here’s the blog post from whatbubble.blogspot.com from April 2006.
So… continuing on.
5. Homeownership rate
This point is actually different from 2006. Apparently back in 2006, the homeownership rates were at an all-time high.
Homeownership is now at an all-time high already… – 3% above the historical average – at least for now until the foreclosures really begin to kick in, at which point lives (and credit) will be ruined, life savings lost, comps forced down, and foreclosed properties added to Supply.
– WhatBubble
This one surprised me as I don’t believe this is true now – the very high homeownership rate. Looking for data I found this graph that shows the height of the 2008 homeownership rate at 69% – about 3% more than the previous height at 6%. Granted the scale of the graph is just 62%-70% but this is just a stat that changes very slowly.
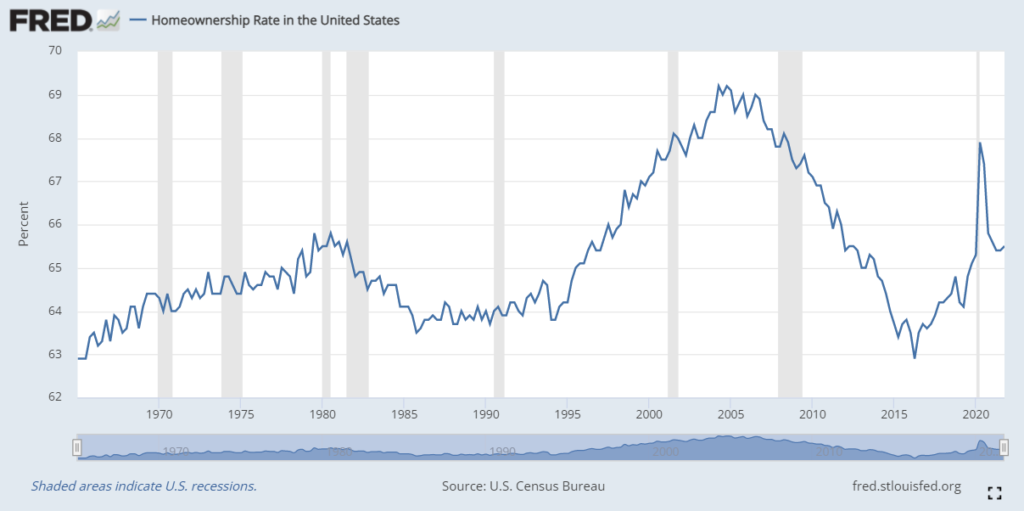
So what do we think about this? Well first we can ignore the huge spike in 2020. That spike is an anomaly related to people moving back home to “wait covid out”.
Homeownership rate is the “percentage of U.S. homes that are owner-occupied, out of total occupied homes”.
So it looks like we’re at 65.5%, fairly close to historical average. It has increased from 2016-2022 but not to the highs of 2005. So what does this say to me? Well this time around, despite the massive demand from millennials, maybe it’s not all owner-occupiers that are buying houses to live in. Which of course brings us back to the “mom and pop” BRRRR investors mentioned in the previous post.

What happens to homeownership rate when the nurse buys 1000 units? None of those homes are owner-occupied so the homeownership rate does not tick up. In fact, if she bought the houses from actual primary owners, the homeownership rate goes down, or at least has downward pressure exerted on it.
So the fact that homeownership rate has not improved as rapidly as 2006 jibes with the fact that investors are big part of the equation now. And that this is in fact, a different situation than 2006.
Okay it’s different. But is it less likely to come down or crash? Are investors less likely to dump properties they don’t live in when they are underwater, than owner-occupiers that do live in the home? Doubt it. They will dump them faster than we can imagine.
6. Affordability
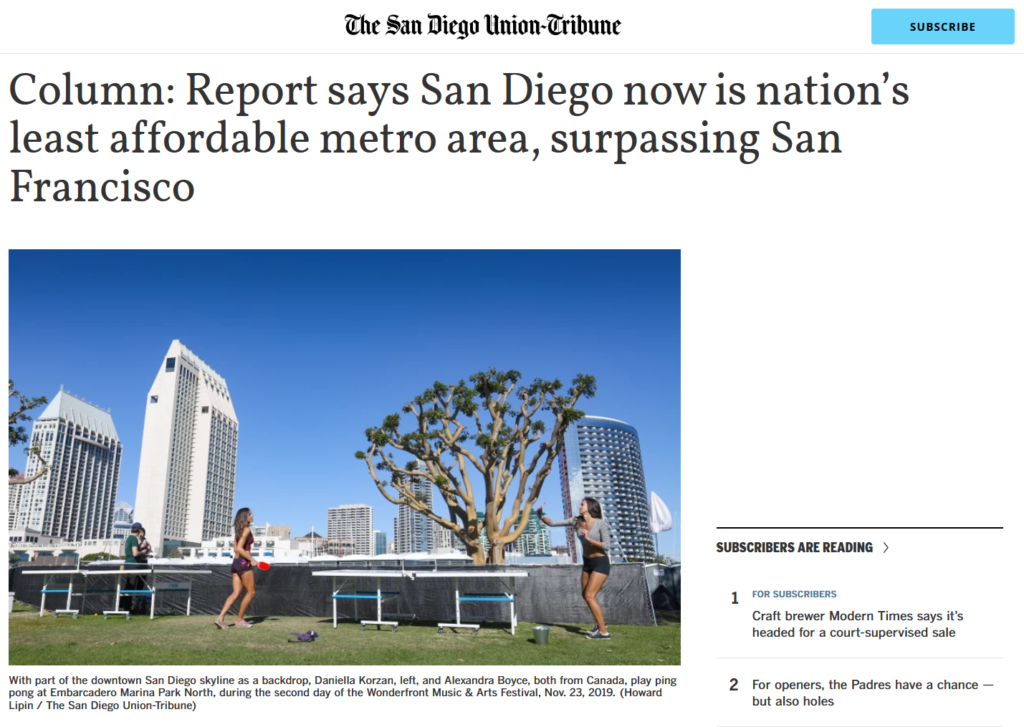
The next point the blogger brings up is that affordability is at 2% in San Diego – which is to say only 2% of San Diegans can afford to buy a median priced home here. I can’t find this exact stat now but the latest headline is that San Diego has surpassed SF as the nation’s least affordable metro. So it’s fair to say it’s pretty damn unaffordable today.
The author goes on to say that if first-time buyers are locked out of buying, we’re in a gridlock and buyers moving to their second homes cannot sell. Which means it’s unsustainable and eventually sellers will have to come down.
Of course today, the narrative is that sellers won’t sell ever because they locked in a low rate. But already, we see that sellers are dropping prices at higher rates. Not yet noticeable in San Diego, but in nationwide numbers.
Twelve percent of homes for sale had a price drop during the four weeks ending April 3, up from 9% a year earlier and the highest share since early December. The rate of sellers dropping their prices is growing faster month over month than it has since August.
“Price drops are still rare, but the fact that they are becoming more frequent is one clear sign that the housing market is cooling,” said Redfin Chief Economist Daryl Fairweather. “It goes to show that there’s a limit to sellers’ power.
– Redfin
Why are these sellers giving up their amazing low mortgage rate only to compete for a new house at the 5% we see today? Well, sometimes people just have to move. But also, we have no idea how many of these sellers are those aforementioned speculative investors, who aren’t going to hold on to houses they aren’t even living in. They aren’t giving up this mortgage rate for another since they don’t need to buy another house.
7. Psychology
Finally, we come to the last point, psychology.
Just as appreciation fuels appreciation, the same is true for depreciation. “Buy before you’re priced out forever” – that was the psychology (and Realtor cliche).
– WhatBubble
This is interesting to me, because I really did not know that this was the catchphrase back then too! We hear this all the time now. Here are some examples from reddit.com/r/realestate.
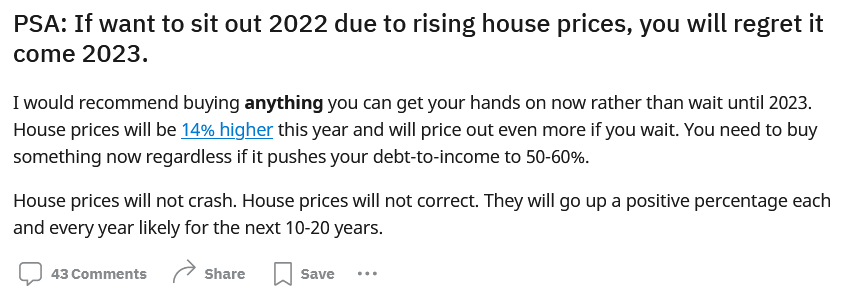
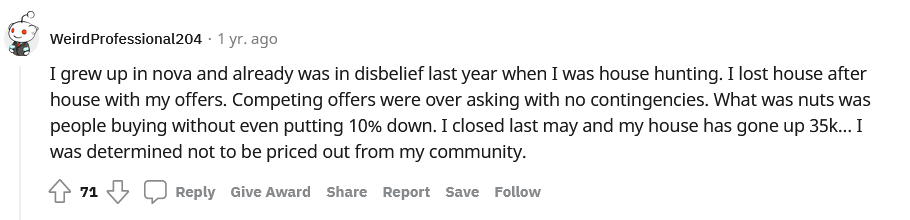
It’s actually very sad, but fear is a powerful emotion. I saw a number of posts from people regretting their monthly payments, and I could see the fear in their reasoning to buy at prices they can’t really afford. “We live in IL, house market will never go down and we will never buy.“, a young immigrant couple says. This is all very much the same as 2006.
Not everyone can afford to buy a home, but if we get to the point where most people can’t afford to rent a home, the pitchforks are going to come out.
On the flipside of this, is the FOMO – Fear of missing out. Real estate investors are piling in to avoid missing out on huge gains they see on tiktok and youtube. Yes, tiktok real estate investors are a thing, bragging about their “passive income” rentals. Real estate has never been and will never be passive income.

I actually do think this IS different than 2006. These investors are doing risky things (like wholesaling and hard money loans) and banking on forever increasing rental prices. However, regular people need to be able to afford rents, and they are rising out of reach of normal folks. Not everyone can afford to buy a home, but if we get to the point where most people can’t afford to rent a home, the pitchforks are going to come out.
Same circus, different monkeys
So here we are, are there aspects that are different? Sure, but the broad strokes of this bubble feel depressingly the same as the last one. We learned nothing.
I leave you with one last quote from our blogger from the past…
The “ceiling of affordability” has been pushed up and up through a credit expansion driven by incredibly low interest rates, “creative lending”, collusion and fraud. This, coupled with speculation created a huge amount of demand – artificial, inflated demand. This demand help to sustain the bubble, fueling it to unprecedented levels. But there’s nowhere left to go.
– WhatBubble
It feels today like there’s nowhere left to go, but we shall see what happens over the next few months.
Disclaimer: I’m an idiot first time home buyer. I’ve never taken an econ class in my life. I’m just sharing what I see and learn as it happens. I am 100% certain I will get things wrong, so don’t take any of this as the golden truth.