As the market changes, more questions pop up in my mind and it helps to make visualizations to answer those questions. One of these is the a new inventory dashboard I’ve made available in the Research section of the site.
Inventory Dashboard
The inventory dashboard shows how new listings, delists and pending sales add up to either increasing or decreasing inventory.
It helps answer the question “Why is inventory going up or down in my city?“
Here’s San Diego, for example. You can see that inventory started to fall in August. Why is this happening? Is it the low mortgage rates causing many more sales than a few months ago? Or is a lot fewer listings?

Let’s take a look at the bars in the bottom of the chart:
- The height of the bars indicates new listings. You can mouseover any bar to see the actual numbers. It’s clear that the number of new listings is decreasing very rapidly. This is more than a seasonal decline.
- The teal sections represent pending sales. These are also down 35% yoy but has stayed relatively steady month to month, since the end of June.
- The dark blue represents net listings – as in, the listings that result in increased inventory. You can see where there are blue bars, inventory goes up. Earlier in the year, Feb through August, this was helping us build inventory.
- But when the teal bar drops below 0, that shows that more listings were delisted or sold that month, than were added, resulting in inventory going down. You can see in August, the bars go negative and the inventory goes down.
- Finally, you’ll notice the grey section of the bar IS growing. It represents homes delisted by the seller. This is having a dampening effect on inventory in San Diego. This may not be true in all markets but that’s what we’re seeing here.
So essentially – new listings are down but also a lot of sellers are delisting their places, probably intending to sell next year. This is the main cause of falling inventory. I intend to come back to this dashboard over the rest of the year to get a sense for how inventory is moving.
Are delists bad for buyers?
Let’s talk about that for a second. At first glance that’s concerning, sellers decide not to sell, inventory won’t go up, so prices will not correct? Not really, prices are correcting despite sellers backing out. Remember while some sellers delist, others need to sell. Those sellers are dropping prices appropriately and making the sale.
It’s those sales that will set the median price and the comps now. It’s not like the prices freeze while they wait. Look at the median sales price drop from July to August – $48,000.
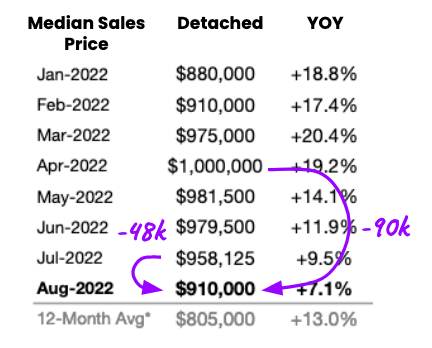
That’s a massive drop, setting comps in all those neighborhoods, for all those sellers who didn’t sell. The stubborn sellers can hold on until spring, but they’re losing equity every month.
Of course, more inventory is still always better. So it would certainly be nice if they kept those places listed. But – at least we know some sellers want to sell. There’s been a lot of concern about “locked up sellers” who will “never sell” because of their low rates. But these sellers were trying to sell so they’re likely to relist in the spring. Just like everyone likes to talk about pent up demand, these sellers represent pent up supply.
They may also choose to rent the place out, in which case we should see rental vacancy rise. As rental vacancies rise, rents might start falling. This is another valuable stat to track.
Overall, it’s disappointing to see the inventory go down but at least it’s not due to rising demand. And despite the tight inventory, prices continue to go down, which is the opposite of what everyone was saying earlier this year…
Some homebuyers are undoubtedly wondering if they should hold out on house hunting and wait for price gains to reverse. But experts caution that prices aren’t likely to drop in the near future.
– The Mortgage Reports, March 2022
“The lack of inventory and current demand to own a home will keep pricing pressure on an upward trend,” says Casey.
Prices are absolutely on the decline in San Diego. And hopefully it holds up. As long as the rates stay high, I believe it will. That said, I’ll be watching this dashboard over the next few months to see how things change as we move into the slow season.
Disclaimer: I’m an idiot first time home buyer. I’ve never taken an econ class in my life. I’m just sharing what I see and learn as it happens. I am 100% certain I will get things wrong, so don’t take any of this as the golden truth.